7. Response as an Asset Manager
The Group's Asset Management Division comprises Daiwa Asset Management, which handles securities asset management, and Daiwa Real Estate Asset Management (including Daiwa Office Investment Corporation), which handles real estate asset management. Both companies are committed to realizing a carbon-neutral society through their businesses.
(1) Daiwa Asset Management
① Governance
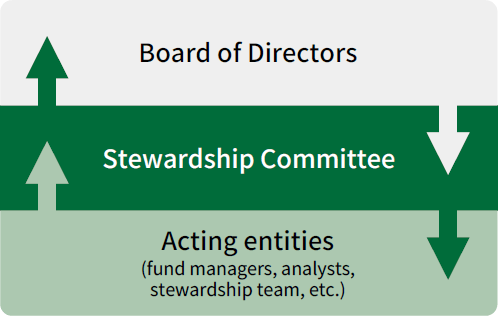
Daiwa AM addresses ESG issues, including climate-related risks, in accordance with our General Policy on Stewardship Activities, which has been decided on by our Stewardship Committee, and with our ESG Investment Policy, which incorporates sustainability considerations. Related activities and policies are deliberated on and monitored by the Stewardship Committee. The Stewardship Committee reports to the Board of Directors on monitoring status in relation to the TCFD.
Framework
② Strategy
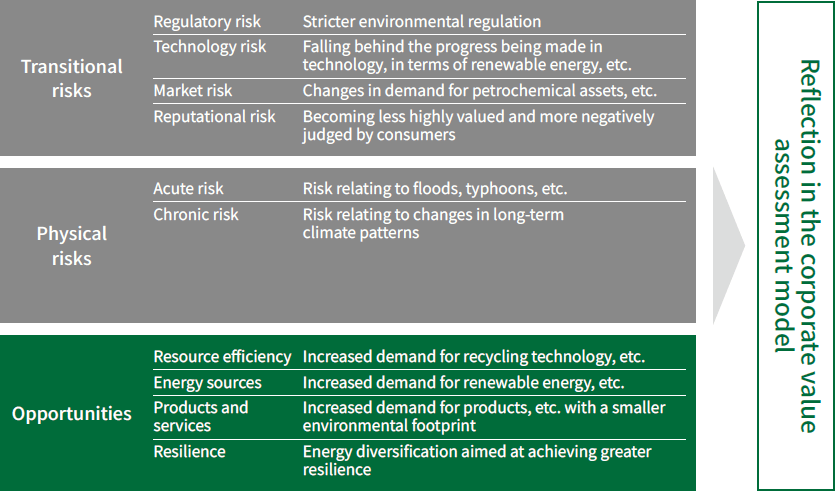
The climate-related risks and opportunities are reflected in Daiwa AM's corporate value assessment model, and are utilized in the selection of investee companies. We also aim, through our engagement activities, to guide companies toward a focus on decarbonization and nature-positive management, so as to enhance investee companies' corporate value. Particularly in regard to climate change, we perform scenario analysis using indicators that include conditional value at risk (CVaR) to verify portfolio risk and resilience.
Reflecting identified climate-related risks and opportunities in the corporate value assessment model
Products
The company offers various investment trusts aimed at achieving a decarbonized society. For details, please refer to "4. Strategy (5) Climate-related Strategies ③ Development of products and services, and promotion of investment and lending focused on sustainability".
Engagement
The company identifies climate change as one of its material issues and engages with investee companies. For details, please refer to "4. Strategy (5) Climate-related Strategies ⑦ Strengthening stakeholder engagement".
③ Risk Management
Daiwa AM uses information disclosed by companies, data from external vendors, the research and engagement conducted by Daiwa AM itself, and dialog with companies, to monitor the climate-related risks and opportunities for investee companies. Daiwa AM has also put in place a framework for utilizing external vendors' data as a basis for measuring the greenhouse gas emissions of the investee companies in our portfolio, and conducting climate change risk scenario analysis, and monitors and manages risk through periodic analysis.
④ Metrics and Targets
As GHG emissions indicators, we perform monitoring and analysis of total CO2 emissions by fund and by asset class, and of carbon footprint, carbon intensity, etc. On the basis of this data and our own original research, we undertake engagement activities with companies to encourage proactive decarbonization.
Analysis of the main indicators relating to total CO2 emissions
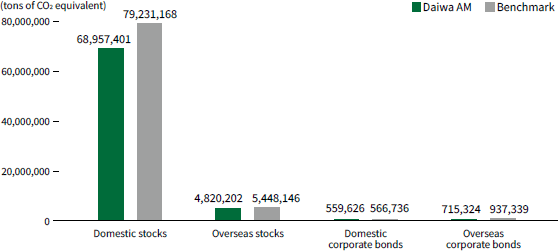
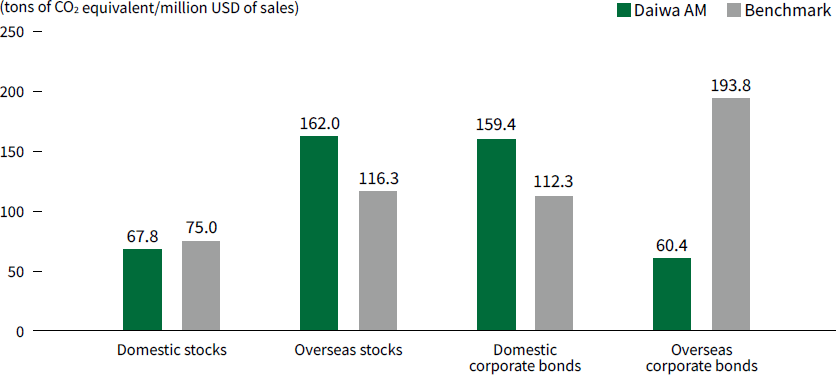
Daiwa AM has compared the total carbon emissions, carbon footprint, and weighted average carbon intensity for each of the asset classes that we invest in against the respective benchmarks for each class. The carbon footprint is an indicator measuring emissions in relation to portfolio size (market capitalization), while carbon intensity is an indicator measuring carbon emissions of investee companies per unit of sales. For each of these, climate change risk management is performed appropriately by implementing analysis and monitoring. As shown in the table on the next page, Scope 3 emissions were categorized as upstream or downstream, and the relevant emissions for each were calculated. Daiwa AM is striving to promote the decarbonization of its entire supply chain, by establishing a detailed understanding of the total carbon emissions of our investee companies, including Scope 1, Scope 2, and Scope 3 emissions, with a particular emphasis on Scope 3, and making effective use of this information in engagement activities with investee companies.
Carbon footprint and weighted average carbon intensity for overseas equities were found to exceed the benchmark values. This was attributable to having the stocks of Indian corporations accounting for a sizeable share of the investment portfolio. In the case of Japanese corporate bonds, although the carbon footprint was affected by the inclusion in the portfolio of the corporate bonds of electric power companies at a weight higher than the benchmark, the disparity with the benchmark was smaller than in the previous year, and there was also a fall in weighted average carbon intensity, so an improvement could be seen. Going forward, we will continue to utilize engagement activities, etc. to encourage investee companies to implement measures in relation to climate change.
For details, please refer to the "Sustainability Report 2024."
Portfolios' total carbon dioxide emissions
| Daiwa AM | Benchmark | Disparity | |
|---|---|---|---|
| Domestic stocks | 6,225,937 | 7,275,447 | -14% |
| Overseas stocks | 961,975 | 732,306 | 31% |
| Domestic corporate bonds | 161,159 | 81,818 | 97% |
| Overseas corporate bonds | 62,161 | 169,474 | -63% |
| Total | 7,411,231 | 8,259,044 | -10% |
| Daiwa AM | Benchmark | Disparity | |
|---|---|---|---|
| Domestic stocks | 20,538,700 | 22,396,744 | -8% |
| Overseas stocks | 1,164,744 | 1,320,133 | -12% |
| Domestic corporate bonds | 191,932 | 162,889 | 18% |
| Overseas corporate bonds | 198,270 | 238,558 | -17% |
| Total | 22,093,646 | 24,118,323 | -8% |
| Daiwa AM | Benchmark | Disparity | |
|---|---|---|---|
| Domestic stocks | 42,192,765 | 49,558,978 | -15% |
| Overseas stocks | 2,693,483 | 3,395,708 | -21% |
| Domestic corporate bonds | 206,535 | 322,029 | -36% |
| Overseas corporate bonds | 454,892 | 529,307 | -14% |
| Total | 45,547,675 | 53,806,022 | -15% |
- *1Benchmarks: Domestic stocks: TOPIX (with dividends included) Overseas stocks: MSCI ACWI ex Japan Index Domestic corporate bonds: Bloomberg Asian-Pacific Japan Corporate TR Index Value Unhedged JPY Overseas corporate bonds: Bloomberg Global Aggregate ex-JPY-Corporate TR Index Unhedged USD
- *2Source: Some information is derived from ©2025 MSCI ESG Research LLC. Reproduced by permission
Carbon footprint of portfolio (Scope 1, Scope 2)
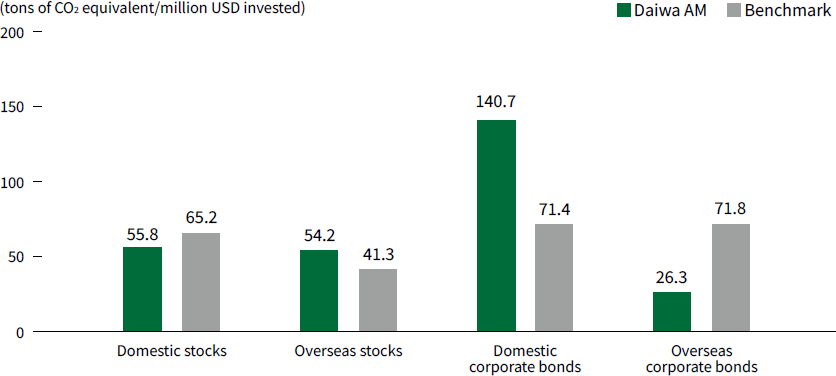
Weighted average carbon intensity of portfolio (Scope 1, Scope 2)
- *1The benchmarks used were the same as those used in the previous section for portfolio's total carbon dioxide emissions.
- *2Source: Some information is derived from ©2025 MSCI ESG Research LLC. Reproduced by permission.
(2) Daiwa Real Estate Asset Management
① Governance
The Asset Manager has established the Climate Change and Resilience Policy, the policy for responding to climate-related risks and opportunities and working to make business and strategy resilient to climate-related issues. In accordance with the policy, Chief Climate- Related Issues Officers (general managers of departments engaged in sustainability promotion) make regular reports to the Chief Executive Officer for Climate-Related Issues (President and Representative Director) at Sustainability Promotion Committee meetings. The reports cover matters related to responses to climate change, including identification and evaluation of impacts of climate change, management of risks and opportunities, progress of initiatives for adaptation and mitigation, and indicator and target setting. The Sustainability Promotion Committee deliberates and discusses issues related to climate change, after which the Chief Executive Officer for Climate-Related Issues makes final decisions.
Under this system, climate-related issues are supervised by the President and Representative Director.
② Strategy
To factor climate-related risks and opportunities into the Investment Corporation's real estate management business, the Asset Manager conducted a scenario analysis, using a 1.5°C /2°C scenario and a 4°C scenario. For each scenario, the Asset Manager classified the financial impacts of identified risks and opportunities into short-term, medium-term and long-term impacts and examined relative scales of impacts on the Investment Corporation. Shown below are medium-term and long-term risks from climate change that have a certain degree of financial impacts.
Financial Impacts in the Scenario Analysis (DOI)
| Cficalassition | Risk and Opportunity Factors in Real Estate Management | Potential Financial Impacts | Category | Financial Impacts | Countermeasures | ||||
|---|---|---|---|---|---|---|---|---|---|
| 4℃ | 1.5℃/2℃ | ||||||||
| Mid Term | Long Term | Mid Term | Long Term | ||||||
| Transition Risks and Opportunities | Policy and Legal | Stricter regulations against GHGemissions due to an introduction of carbon tax |
|
Risk | Small | Small | Medium | Large |
|
| Stricter energy-saving standards, obligation to report emissions |
|
Risk | Small | Small | Large | Large | |||
| Enhanced competitiveness of properties that comply with legal regulations |
|
Opportunity | Small | Small | Medium | Medium | |||
| Technology | Advancement and spread of energy-saving and renewable energy technologies |
|
Risk | Small | Small | Large | Large |
|
|
|
Opportunity | Small | Small | Medium | Medium | ||||
| Market | Fluctuations in properties' asset value depending on environmental performance |
|
Risk | Small | Small | Large | Large |
|
|
|
Opportunity | Small | Small | Medium | Medium | ||||
| Changes in the stances of investors/lenders/tenants on investment and lending |
|
Risk | Small | Small | Large | Large |
|
||
| Opportunity | Small | Small | Medium | Medium | |||||
| Reputation | Decline in reputation from investors and customers |
|
Risk | Small | Small | Medium | Large |
|
|
| Physical Risks | Acute | Increased loss due to intensifying storm and flood damage |
|
Risk | Small | Medium | Small | Small |
|
| Chronic | Increased damage from rise in average temperature/sea level | Risk | Small | Small | Small | Small | |||
Financial Impacts in the Scenario Analysis (DLI)
| Cficalassition | Risk and Opportunity Factors in Real Estate Management | Potential Financial Impacts | Category | Financial Impacts | Countermeasures | ||||
|---|---|---|---|---|---|---|---|---|---|
| 4℃ | 1.5℃/2℃ | ||||||||
| Mid Term | Long Term | Mid Term | Long Term | ||||||
| Transition Risks and Opportunities | Policy and Legal | Stricter regulations against GHGemissions due to an introduction of carbon tax |
|
Risk | Small | Small | Medium | Medium |
|
| Stricter energy-saving standards, obligation to report emissions |
|
Risk | Small | Small | Medium | Medium | |||
| Enhanced competitiveness of properties that comply with legal regulations |
|
Opportunity | Small | Small | Small | Medium | |||
| Technology | Advancement and spread of energy-saving and renewable energy technologies |
|
Risk | Small | Small | Medium | Medium |
|
|
|
Opportunity | Small | Small | Medium | Medium | ||||
| Market | Fluctuations in properties' asset value depending on environmental performance |
|
Risk | Small | Small | Medium | Medium |
|
|
|
Opportunity | Small | Small | Small | Medium | ||||
| Changes in the stances of investors/lenders/tenants on investmentand lending |
|
Risk | Small | Small | Medium | Medium |
|
||
| Opportunity | Small | Small | Small | Medium | |||||
| Reputation | Decline in reputation from investors and customers |
|
Risk | Small | Small | Medium | Medium |
|
|
| Physical Risks | Acute | Increased loss due tointensifying storm and flood damage |
|
Risk | Medium | Medium | Small | Small |
|
| Chronic | Increased damage from rise in average temperature/sea level | Risk | Small | Small | Small | Small | |||
③ Risk Management
The Investment Corporation's Climate Change and Resilience Policy sets out processes to identify, assess, and manage the impacts of climate change risks and opportunities on the corporation's management activities, strategies, financial plans, etc.
- Chief Climate-Related Issues Officers summarize climate-related risks and opportunities and report the progress to the Sustainability Promotion Committee, in principle, once a year.
- The Sustainability Promotion Committee continuously identifies, assesses, and manages climate change risks and opportunities that are important to the business and financial plans and affect the asset management operations of the Investment Corporation. Based on the above reports, the committee prioritizes issues of strategic importance to the business.
- The Chief Executive Officer for Climate-Related Issues instructs to factor important climate-related risks with high priority, which have been deliberated by the Sustainability Promotion Committee, into the existing company-wide risk management program. The risk identification, assessment, and management processes are thus integrated.
④ Metrics and Targets
Each Investment Corporations sees the transition to a carbon-neutral society as an opportunity. The following target KPIs (Key Performance Indicators) have been established as key monitoring indicators in the process of managing climate change risks and opportunities.
For details, please refer to the website of Daiwa Office Investment Corporation and Daiwa Securities Living Investment Corporation.
| KPI | |
|---|---|
| Reduction of CO2 emissions | Mid-term target (FY2030): Reduction of 46% in CO2 emissions on an intensity basis across the portfolio by FY2030 (compared with FY2013) |
| Long-term target (FY2050): Achieved carbon neutrality in CO2 emissions on an intensity basis across the portfolio by FY 2050 |
|
| Percentage of environmental certifications acquired | Mid-term target (FY2030): Achieve an environmental certification ratio of at least 70% for the entire portfolio |
| KPI | |
|---|---|
| Reduction of CO2 emissions | Mid-term target (FY2030): Reduction of 20% in CO2 emissions on an intensity basis across the portfolio by FY2030 (compared with FY2022) |
| Long-term target (FY2050): Achieved carbon neutrality in CO2 emissions on an intensity basis across the portfolio by FY 2050 |
|
| Percentage of environmental certifications acquired | Mid-term target (FY2030): Achieve an environmental certification ratio of at least 20% for the entire portfolio |